ClaudeScope: Visualize Claude Code Session Trajectories

Shanghai Jiao Tong University
ClaudeScope full interface

The complete ClaudeScope interface — session picker, summary, interactive timeline / token / tool views, and an event inspector.

What is ClaudeScope?

Every time you use Claude Code, a full trace of the session — every user prompt, every assistant reply, every thinking block, every tool call (Bash, Edit, Read, TaskCreate, Agent, …) along with exact timestamps and token usage — is recorded as a JSONL file under ~/.claude/projects/.

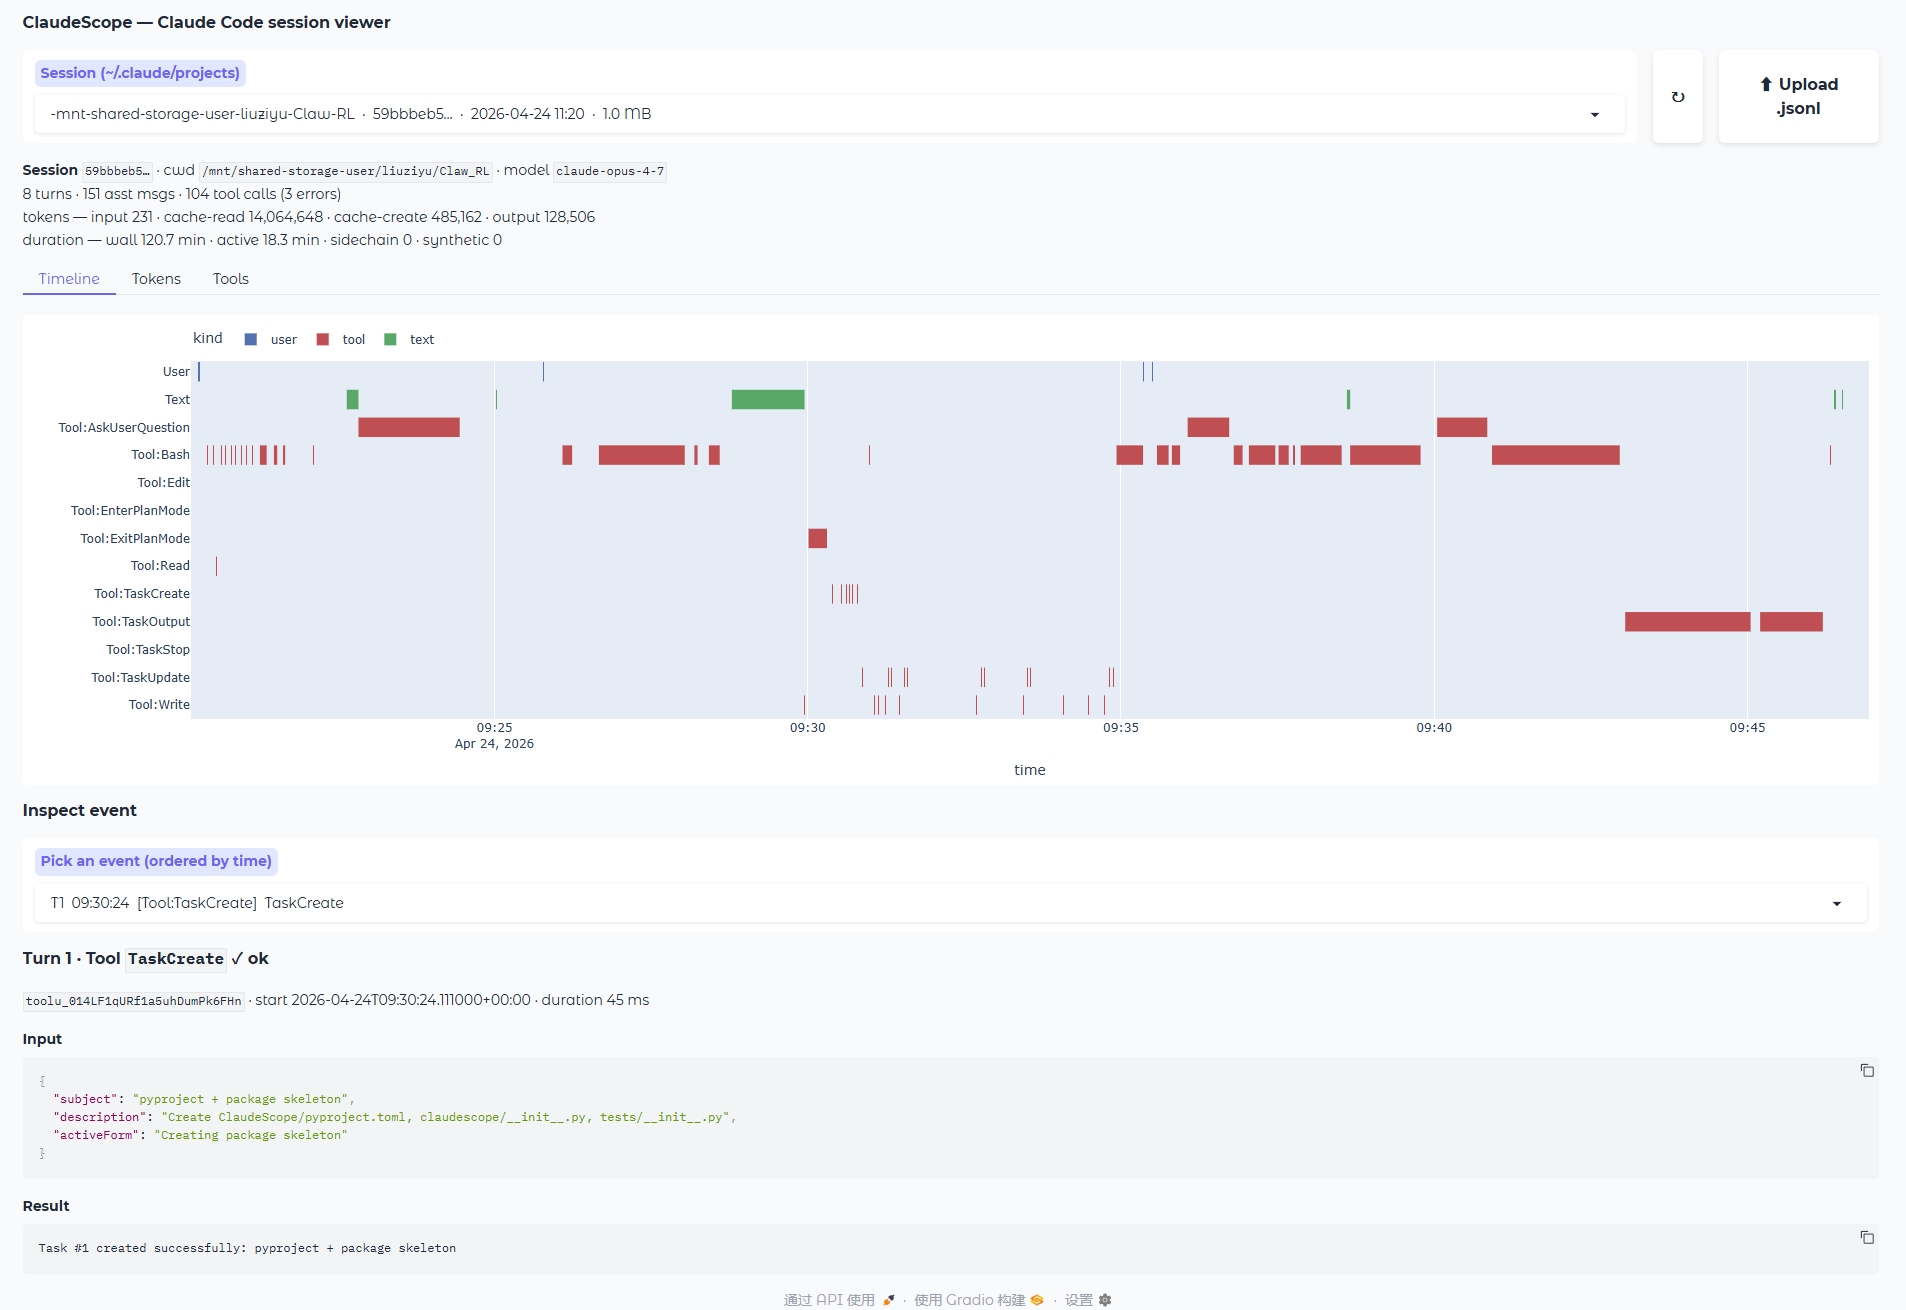
ClaudeScope turns that raw log into an interactive Gradio dashboard, so you can literally watch what the agent did — when it was reasoning, when it was waiting on a slow Bash command, where tokens were being spent, and exactly what failed. It is built for researchers who study agent behaviour (failure modes, action patterns, cost) and for developers who simply want to understand where their Claude Code session time went.
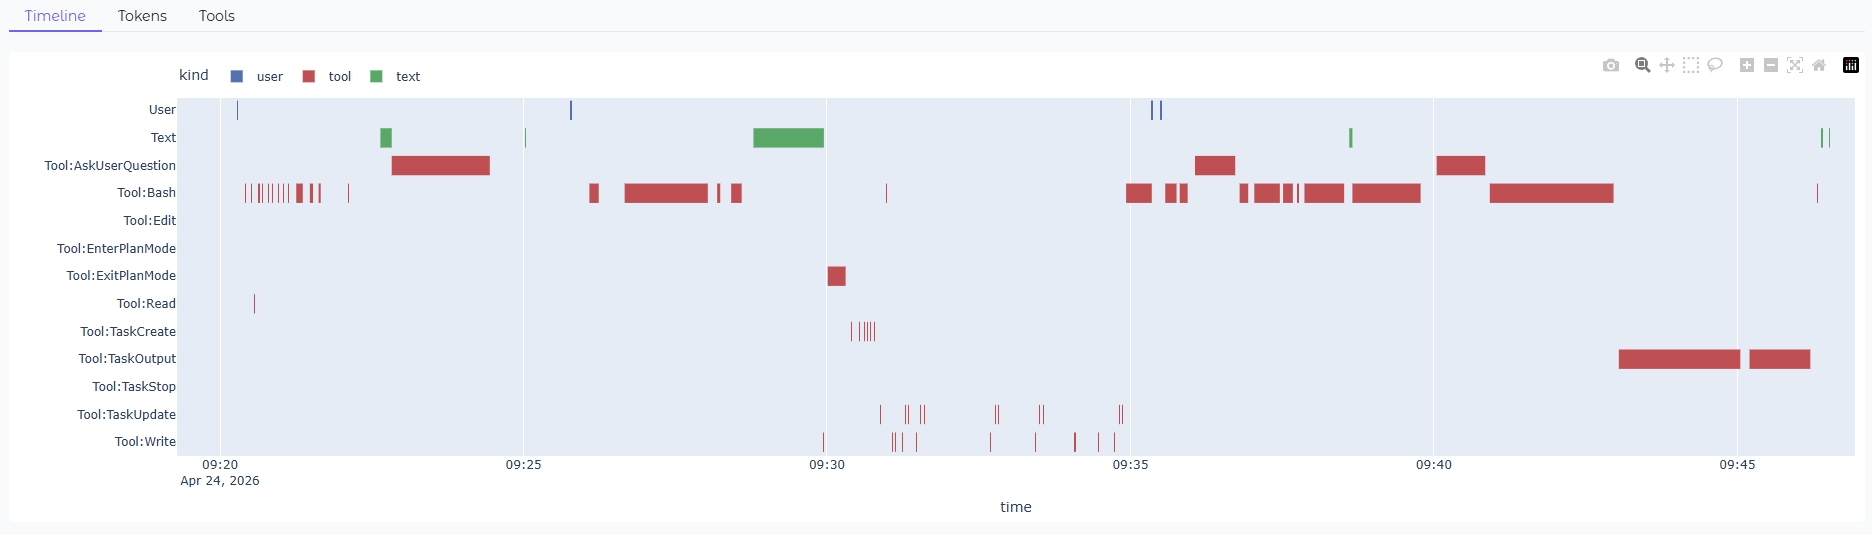
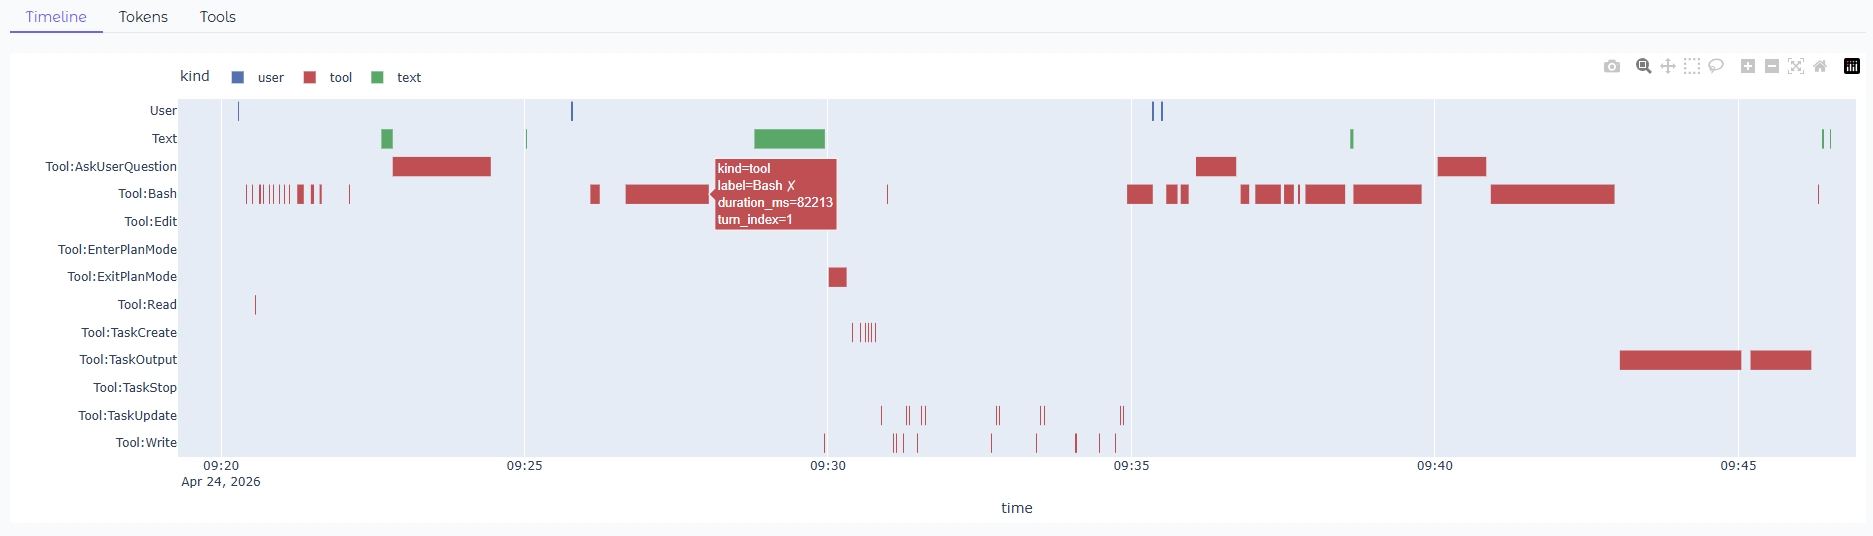
Timeline Gantt

Every user / text / thinking / tool block on parallel lanes across real time.
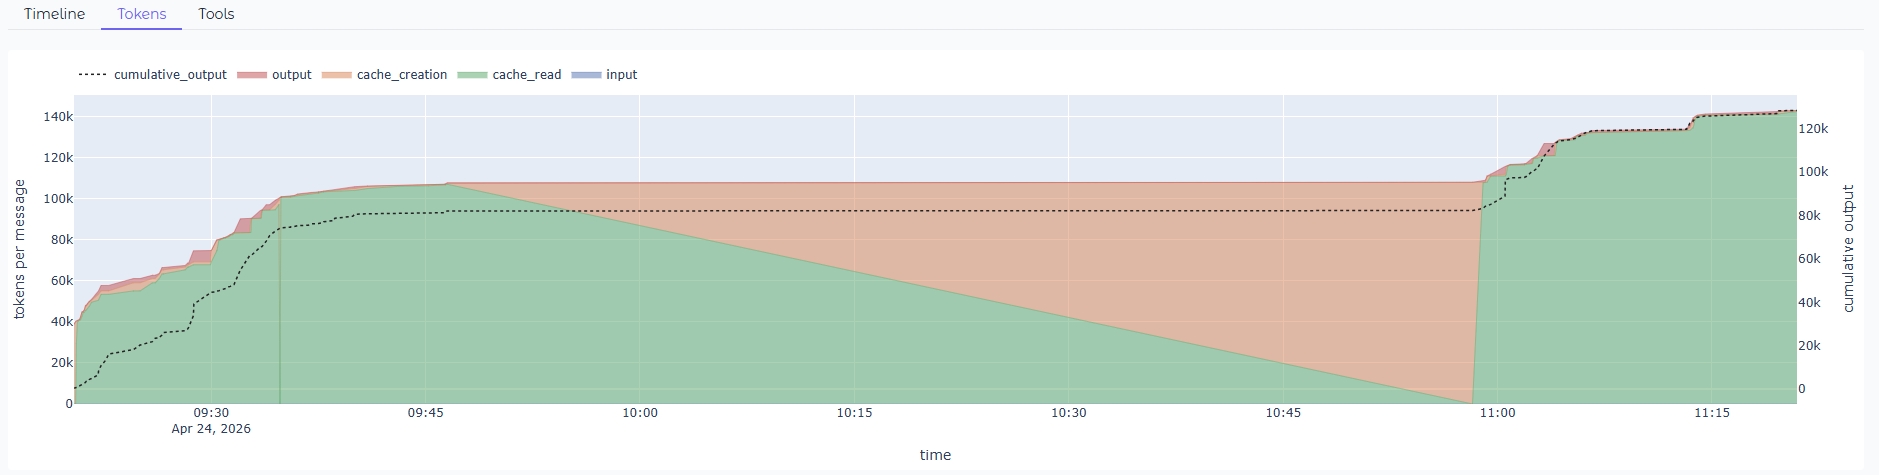
Token Stream

Per-message stacked tokens with cumulative output, so you can see cost grow.

Tool Stats

Per-tool call counts, wall-time, and failure rates — find the tool eating your session.
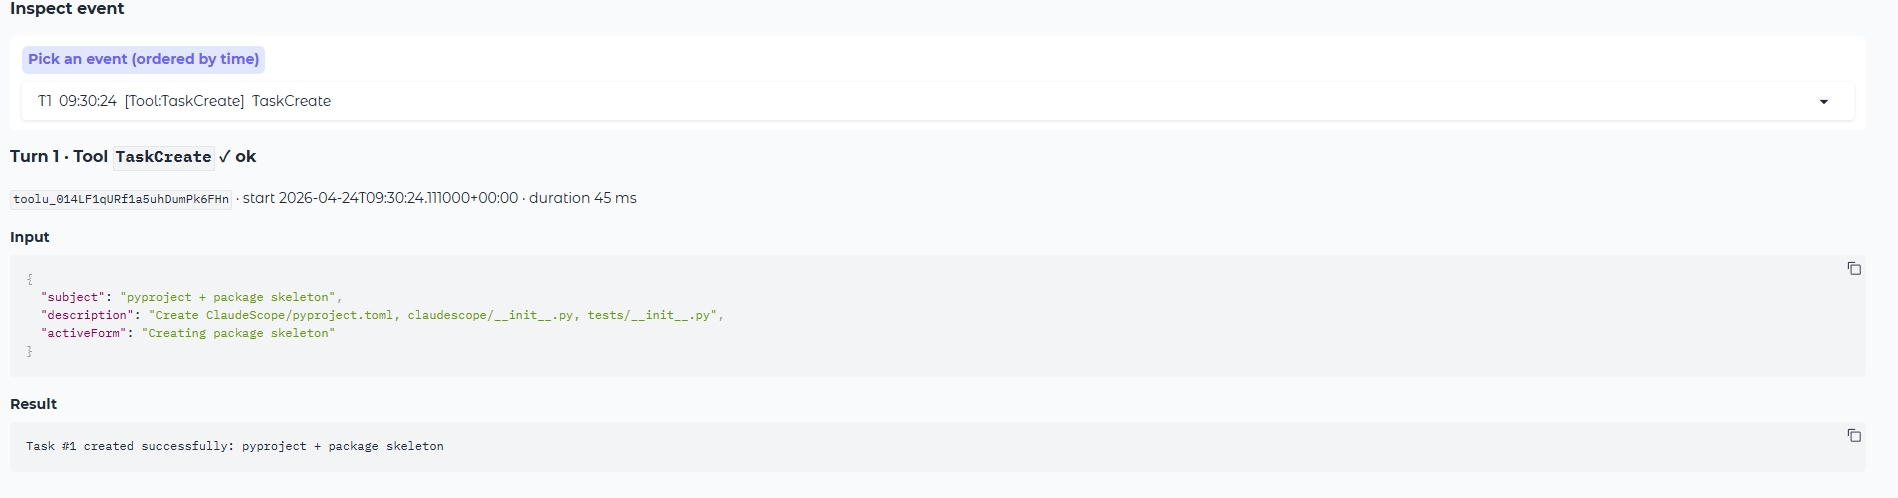
Event Inspector

Drill into any single step — inputs, outputs, thinking, success or error.

Feature 1

Pick any session, or upload a file

The dropdown lists every session under ~/.claude/projects, sorted by last modified, and tagged with project slug, session id, and file size. Got a trace from a colleague? Just drop the .jsonl file onto the Upload button. A one-line summary appears immediately: turns, assistant messages, tool calls (with error count), token totals, wallclock vs. active duration, and the model(s) used in this session.

Session picker and summary

Session picker + one-line summary. Zero setup: just run python -m claudescope.app and your recent sessions are already listed.

Feature 2

Timeline — see the whole trajectory at a glance

A Gantt chart lays every event on parallel lanes: User prompts, Text replies, Thinking blocks (when extended thinking is used), and one lane per tool (Tool:Bash, Tool:Edit, Tool:Read, Tool:TaskCreate, …). The x-axis is real time, so long Bash waits, clusters of rapid tool calls, and idle gaps between turns jump out immediately. Colors encode the event kind, so at a glance you see when the agent was reasoning versus when it was waiting on a tool.

Timeline Gantt chart

Timeline lanes — user prompts (blue), thinking / text (green), tools (red). One row per tool, so you always know which tool is busy.

Timeline hover tooltip

Hover any block to see exact duration, label (with marking failed tool calls), and the turn it belongs to — debug from a visual scan.

Feature 3

Tokens — cost over time

A stacked-area chart of per-message token usage: input, cache_read, cache_creation, output. A dotted cumulative_output line on the right y-axis shows how spend grows across the session. Useful for spotting:

  • runaway context growth (rising cache_read / cache_creation)
  • turns where the model suddenly produced a lot of output
  • how much the prompt cache is actually helping

The Tools tab adds a per-tool bar chart of call counts and total wall time, with error counts in the hover — handy for finding the tool that is actually chewing up the session.

Token stream chart

Per-message token breakdown plus cumulative output — one chart tells you where the budget went.

Feature 4

Inspect any single event

Pick any step from the ordered dropdown (T<turn> HH:MM:SS [lane] label) to see its full content:

  • User messages — the prompt text
  • Assistant messages — token usage, plain text, a collapsible Thinking block, and the raw input of every tool call
  • Tool calls — name, ✓ ok / ❌ error, start time, duration, full input JSON, and the result preview (auto-truncated for huge outputs)

Perfect for answering "what exactly did the agent send to Bash at this step, and what did it get back?"

Event inspector view

The event inspector shows full input, full result, status, and duration — the unit of ground truth for debugging.

🚀 Quick Start

Install with the UI extras and launch the Gradio app:

pip install -e '.[viz,dev]'

python -m claudescope.app              # http://127.0.0.1:7860
python -m claudescope.app --port 9000
python -m claudescope.app --share      # public tunnel

The data layer (claudescope.parser and claudescope.analyzer) only needs pandas; [viz] adds plotly + gradio for the UI.

🧪 Use it as a library

The data layer has zero UI dependencies — perfect for building custom dashboards or bulk analysis over many sessions.

from claudescope import (
    parse_jsonl, summary,
    gantt_events, token_series, tool_stats,
)

s = parse_jsonl("~/.claude/projects/<slug>/<sessionId>.jsonl")
print(summary(s))             # SessionSummary dataclass

timeline_df = gantt_events(s) # one row per visible event
token_df    = token_series(s) # per-message + cumulative
tools_df    = tool_stats(s)   # n_calls, n_errors, durations

📚 BibTeX

If ClaudeScope is useful in your research, please cite it as:

@software{liu2026claudescope,
  author       = {Liu, Ziyu},
  title        = {{ClaudeScope}: Visualize {Claude Code} Session Trajectories},
  year         = {2026},
  organization = {Shanghai Jiao Tong University}
}

Released under the MIT License — © 2026 Ziyu Liu, Shanghai Jiao Tong University.